
How to read food labels
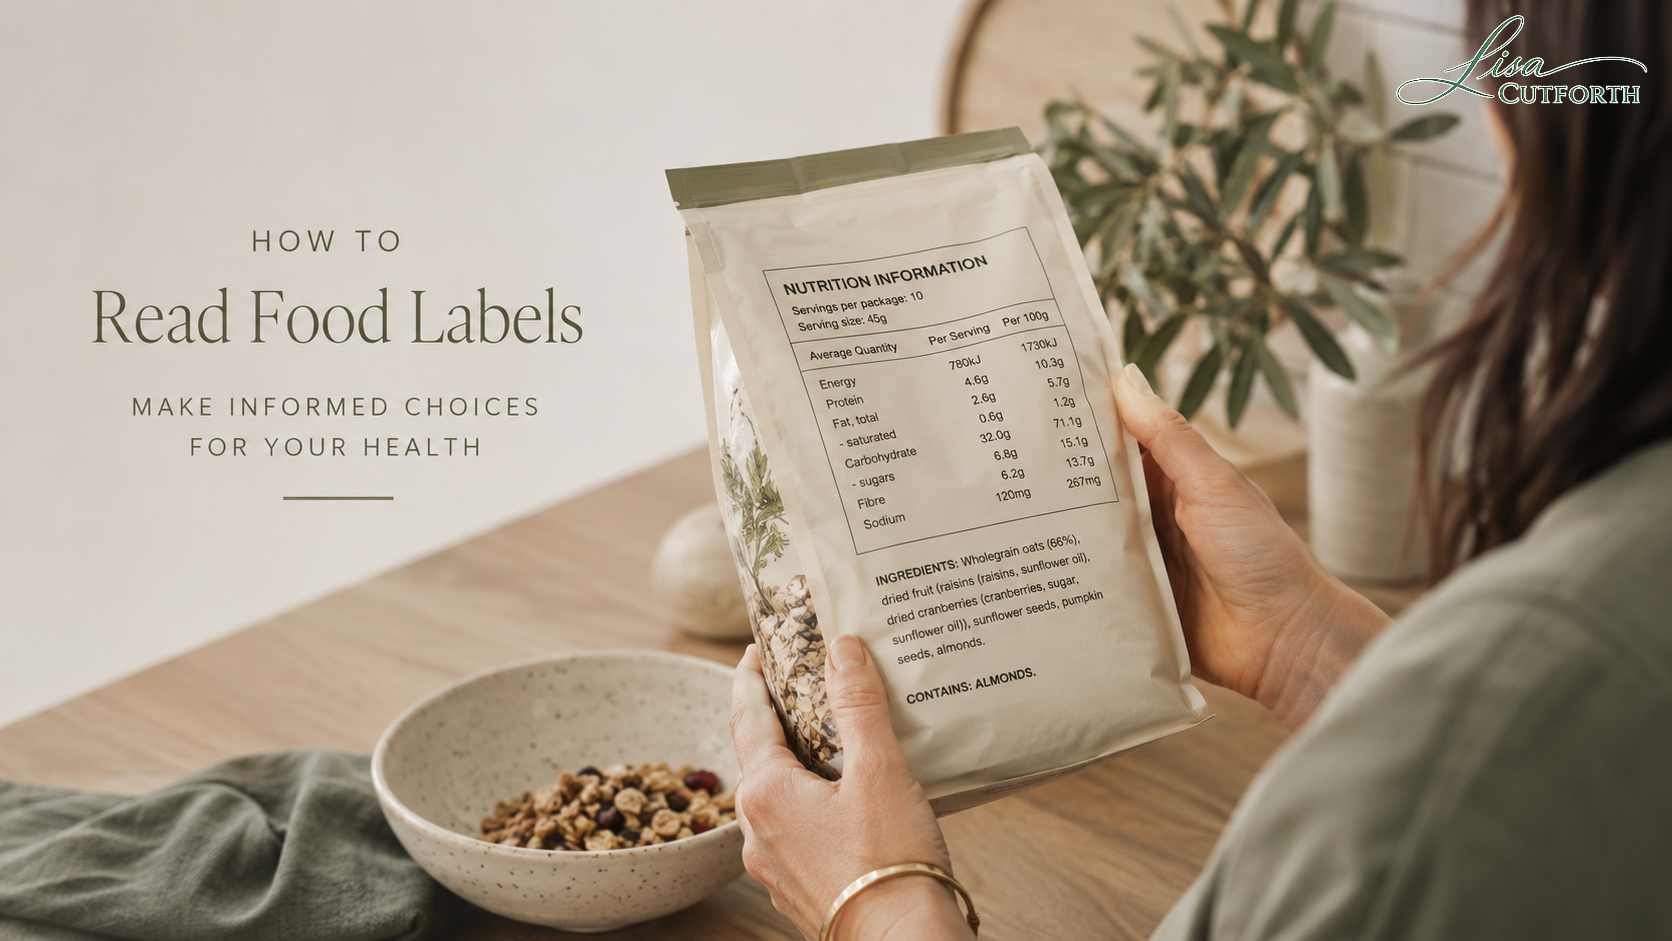
Food labels are designed to be read. They're just not always designed to be understood.
Most real food doesn't come with a label. If it comes with a label, usually it's been through some degree of processing. The front of the packet is marketing. The back of the packet is information. Most of us make our decision from the front, and so it's designed to be attractive. And sometimes a packaged product might advertise its "health benefits" as part of the marketing on the front, it might say "high in fibre", "40% less sugar", "made with whole grains" — and if you never turn the box over to check, you can be lured into a false comfort that you are eating something healthier than it actually is... And that's exactly what the front of the packet is there to do. Get you to buy and consume.
The good news is that reading the back properly takes about twenty seconds once you know the order to do it in. And then it's pretty easy to make a decision about how healthy it is. I'm not suggesting for a second you should never eat it if it's not healthy. BUT I am saying, it's important you know what you are eating and it's important you are not misled into believing you are eating healthier than you actually are, because this is what leads to chronic disease.
Ok, here's the order.
Step 1: Start with the ingredients list
Not the nutrition panel. The ingredients list tells you what the food actually is, and it takes five seconds to read.
The one rule that makes it work: ingredients are listed from most to least, by weight. The first ingredient is the biggest part of the product. The last one might be a pinch.
That's it. That's the whole system. And it means the first three ingredients essentially are the food — everything after that is usually a small player.
What you want to see
Ideally, the first three ingredients are whole foods. Things you'd recognise in a kitchen: oats, tomatoes, chickpeas, milk, beef, potato, egg.
If the first three are refined flour, sugar and a vegetable oil (or a processed fat like palm oil for example), you're eating a flour-sugar-fat product, engineered for its taste with cheap low nutrient value ingredients, regardless of what the front of the box says about oatmeal or fruit or extra protein and fibre.
Watch out for sugar wearing a disguise
This is the trick worth knowing. If a manufacturer used a lot of sugar to make a product, it might be the second ingredient — which looks bad. So they sometimes split it across four different sugars, and each one drops down the list. (It might be called, sugar, then corn syrup, then maltose then dextrose).
Same total sugar in the nutrition panel but a way to get around disclosing the actual content of sugar clearly on the ingredients list.
Sugar goes by all of these names:
cane sugar · glucose syrup · glucose-fructose syrup · corn syrup · invert sugar · dextrose · maltose · maltodextrin · rice syrup · malt extract · molasses · treacle · honey · agave · fruit juice concentrate
What to do: when you spot two or three of these on one list, mentally add them together and ask where sugar would really sit in the order, or that's your cue to then refer to the sugars total in the nutrition panel. But ultimately it tells you this is probably not as healthy as it first looked.
And fat wearing a disguise
Fats do the same thing:
palm oil · palm kernel oil · vegetable oil · vegetable fat · shortening · hydrogenated oil · copha · tallow · mono- and diglycerides of fatty acids
One to know about in Australia: palm oil can legally be labelled simply as "vegetable oil" here. In the UK and Europe it has to be named. So if you see an unspecified "vegetable oil" on an Australian label sitting next to a high saturated fat figure, palm oil is the likely answer. Palm oil even though it is a vegetable oil is high in saturated fat, roughly 50%. And unfortunately because of the processing it's not a particularly healthy one. Palm kernel oil is worse.
There's a second trick with fats. Sometimes an oil appears twice, once on its own, and once hidden inside a bracketed ingredient like "margarine (palm oil, rapeseed oil, water...)". Split across two places, it ranks lower in both. Added together, it might be one of the biggest things in the packet.
Long lists are a signal
A short list of recognisable food is a good sign. A list of thirty items, half of which you can't pronounce, usually means additives, preservatives, colours, flavours, emulsifiers and stabilisers, the stuff required to make something taste fresh months after it was made, with little consideration for your health. Just because it is edible doesn't mean we should be eating it and doesn't mean we should be allowed to call it food, but I don't get to make the rules.
You don't need to fear every additive, some are pretty benign and can add life to a healthy food. But a long list is a reliable clue that you're holding something highly processed, and that's the more useful thing to know.
One more thing: the percentage rule
In Australia, the UK and Europe, if an ingredient is named or pictured on the front of the pack, the manufacturer has to tell you how much of it is in there. This is called QUID, and it's the single most useful rule on any label.
It's how you find out that a "Steak & Potato" pie is 18% beef and 9% potato, 40% pastry. Or that the "Blueberry & Raspberry" biscuit only contains 3% fruit, the vast majority of the biscuit is sugar, flour and fat.
Look for the little percentage in brackets. It's often the most honest number on the packet.
Step 2: Now read the nutrition panel
You'll typically see two columns. Understanding the difference between them is the first step.
The per serve column is what you'll actually eat. The serving size is not set by health guidelines, and it's not standardised, the manufacturer can set the serving size and they can do this based on their internal criteria, and it's usually decided by marketing or money (ie. what makes it more sellable). I say that to say it can be arbitrary, sometimes a serve is unrealistically small and so you eat twice or three times the serve size, and there's nothing stopping you eating more. But, this is the one that matters for your day: how much energy, protein, fat and sugar you are actually consuming. For example, let's say you buy a bag of dark chocolate coated rice cakes, because you think it's a "healthy snack". There's a big happy label at the front telling you they're only 17 calories each, so you eat the whole bag because they're low calorie. The serving size might be a 14g serving (which is 4 mini rice cakes), but let's be honest, who is only having four of these. In reality per 100g they average 450 calories, and as mostly refined carbohydrates from rice, 60-70g, with half of that sugars. Standard share bags are 60-80g in weight and family share packs can be up to 200g. This means that, with the vanishing caloric density (they melt in your mouth, hardly any chewing and don't fill you up) it's easy to eat a bag or at least 100g worth without feeling like you have. I won't get into glycaemic load in this post, but eating a large portion of a refined carbohydrate snack, even one that is marketed as low calorie in a small portion, can spike your blood sugar in a larger portion. So I say all this to say if you are relying on the per serve number to ascertain whether it's healthy or not, pay attention to how much you are eating and whether it meets the serving size.
The per 100g column is the level playing field, if you are trying to compare products. It's the same amount of every product, which makes it the only fair way to compare two things. Let's say you want to decide which snack is healthiest, you might compare their 100g column to each other.
Why does this matter? Because the manufacturer chooses the serving size. There's no standard. One brand can call it 30g, another 45g, and suddenly the smaller-serve product looks healthier, even if it's identical food. And the reality is, if it's not pre-portioned, you probably will use your eyes to judge the serving size or a feeling of fullness to guide you, not an arbitrary weight on the package, unless you are getting the scales out.
The rule: Use per serve to count what you're eating (if you stop at one serve). Use per 100g to compare two products or to calculate your actual serve size (based on what is realistic for you).
Check the serve is realistic
Look at the serving size in grams, and then look at what you'd actually eat. A "serve" that is 3 biscuits doesn't help you if you eat 5. A serve of 4 mini rice cakes doesn't help you if you eat 5 times that amount. A single-serve pie is genuinely one serve, but a "family" pie that says serves four, might realistically be shared between two or three people.
Quick check: servings per pack × serve size should equal the total weight on the front. If it doesn't roughly add up, something's been rounded generously.
A trap worth knowing
It's simple maths but worth pointing out because people get caught out in a quick glance, especially if both the serve size and the per 100g is not listed. If a serve is smaller than 100g, for example a 40g serve of biscuits, the per serve numbers will look lower than the per 100g numbers. That's normal. In 100g you get 2.5 serves.
But if a serve is bigger than 100g, like a 139g pie, a 250g ready meal, then the per serve numbers are higher than the per 100g numbers. And a product can look perfectly acceptable in the per 100g column while delivering a genuinely large amount in the portion you're about to eat.
For anything that's a whole meal, read the per serve column, as that's the most accurate if you're eating it alone.
Step 3: Check it against healthy ranges, with context
Now you can compare the numbers to some general guides.
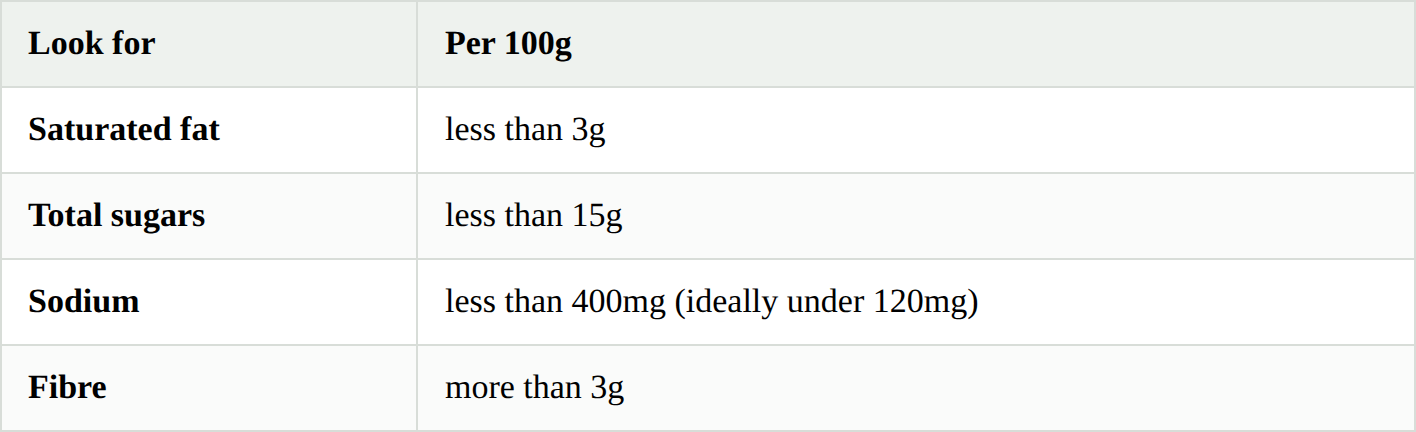
The Australian rules of thumb (per 100g)
These are the simplest ones to remember, and to aim for, if you are looking for a healthy guideline:
The UK traffic light system (per 100g)
The UK puts colours on the front of the pack, using these cut-offs:
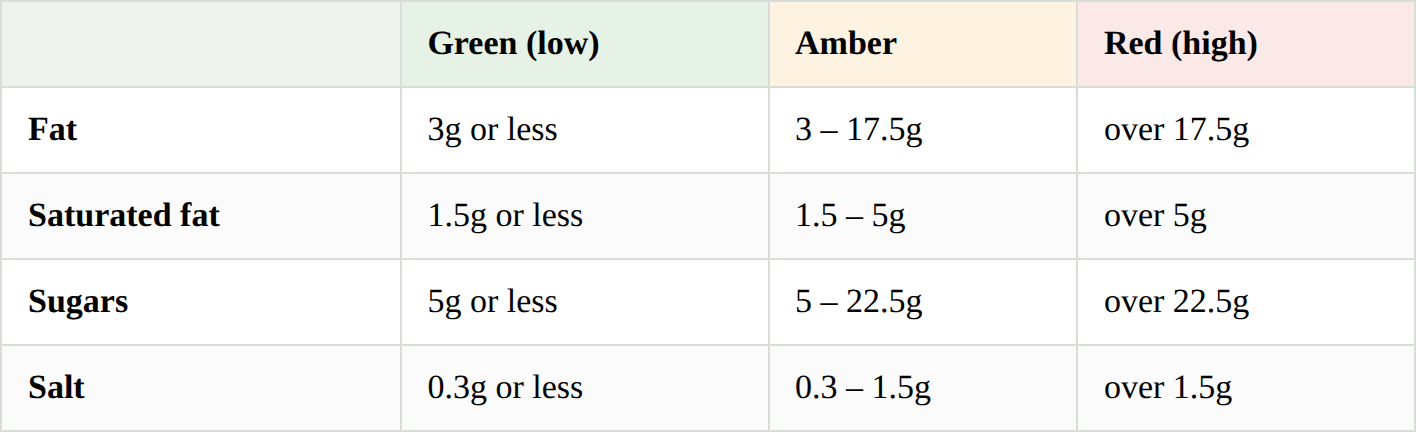
A note on salt vs sodium: Australian labels usually give sodium in milligrams, UK labels give salt in grams. To convert: sodium × 2.5 = salt. So 400mg sodium is 1g of salt.
And protein: in Australia, 5g per serve makes a food a "source" of protein, and 10g per serve makes it a "good source". There's no upper limit to worry about.
Now the important part: context
Here's where label-reading often goes wrong.
A number is not a verdict. Just because something is high in fat, doesn't necessarily make it a bad food. Just because something contains 50g of carbs doesn't mean it's bad. Here's why, certain foods are higher in certain macronutrients. Meat is higher in fat and protein than an apple. That doesn't make the apple healthy and the meat unhealthy, they're different foods doing different jobs. You'd judge a snack bar and a main meal by completely different standards, and you should. A bag of mixed nuts would have a very different nutrition panel than a can of kidney beans, but both are considered whole foods and healthy. Olive oil is just about all fat, but as fats go, it's a healthy one because it's mostly monounsaturated fat, and it's low in saturated fat.
Three examples of where the numbers mislead:
Salmon is high in fat, but that's the reason to eat it. A piece of salmon can carry 13g of fat per 100g, which sounds alarming. But most of it is unsaturated, and it includes omega-3 fats (EPA and DHA) that are genuinely difficult to get from the diet because they aren't present in a lot of foods. You can only get those in fat. Take the fat out and you've taken the benefit out. Applied literally, a traffic light system would flag salmon as high fat, and make it red, and making it completely wrong about the health messaging. Omega 3s are actually protective of the heart, they're anti-inflammatory and help improve blood lipid profiles, and they're important for brain health.
Nuts are high in fat too. They're also high in fibre, contain protein, and come packaged with minerals and plant compounds. The fat is mostly unsaturated. A handful of almonds and a handful of chips have similar fat numbers and nothing else in common. You should choose the nuts over the chips every day of the week if you were trying to make the healthy choice. (Unless you have a histamine intolerance and then you might limit both.)
The most useful trick with fat: Don't look at "total fat". Look at saturated fat as a share of total fat. Divide one by the other. Under 30% is generally a good sign. Over 50% means a hard fat, usually palm oil, coconut oil or butter (high in saturated fats).
Salmon comes out around 20%. A pastry made with palm oil comes out around 50%. So even if the total fat is the same, the type of fat matters more.
What the label can't tell you
The nutrition panel gives you protein, carbs, fat, fibre and salt. That's all.
It says nothing about vitamins, minerals, antioxidants, plant compounds, or the omega-3s in that salmon. A packet of white rice compared to a packet of lentils can look broadly similar on the nutrition panel but be different nutritionally. Nutritionally lentils are superior, but actually eating the two together makes more of a complete protein profile.
So: use the label to understand what you are eating and rule things out, not to decide what's good. Whole foods rarely have labels at all. That's not a coincidence. If it's real food, you can usually eat it without worrying about whether it's healthy or not. And there's usually less risk of overeating natural foods because of something called sensory-specific satiety.
Step 4: Know your own numbers
This is less about the label and more about the person reading it.
Every label you pick up compares itself to a Reference Intake. A reference intake is calculated as a generic adult eating 8,700kJ (Australia) or 2,000 calories (UK) a day. When a pack says "21% of your daily intake", that's the person it means. But the reality is that is only a small percentage of the actual population that fits this guide.
That person might not be you. Your requirements shift with age, sex, weight, height and how active you are, and two things move the most:
Energy. A smaller, older, less active person might need 7,000–7,500kJ (1,700–1,800 calories) a day. A larger or more active person might need 10,500kJ (2,500 calories) or more a day. Every percentage on every label is calculated for someone in between these two. So you need to know your BMR. (Your BMR represents your basal metabolic rate and is the minimum calories your body needs a day to stay alive and function at rest.) (Your age, height, weight, biological sex and activity level affect how many calories you need a day).
Protein. This one changes with age. It's a U-shaped graph. Teenagers and older adults need more protein than the average adult aged 20-60, and therefore usually need more than is reflected on the label reference. Teenagers need 0.85-0.95 grams per kg of body weight while adults over 65 need roughly 1.0 to 1.2 grams per kilogram of body weight, to protect muscle. The reference intake on the pack is 50g. A 62kg 46-year-old may only need 50g of protein per day but a 62kg woman in her seventies needs 62–75g, and spread across the day rather than all at dinner. And a 62kg teenager needs anything from 50g-90g a day. A 53kg teenager already needs close to 50g of protein.
Here's why it matters. Take a 76-year-old woman, 168cm and 62kg, working part-time. Her energy requirement is around 7,500kJ (1,800 cal) and her protein target is about 70g.
When she picks up a pie that says "21% of your daily energy", the real figure for her is 24%. Every percentage on that pack understates her share by about a tenth. So she's at risk of overeating her daily energy, but the opposite for her protein. Her protein target is 40% higher than the label's, so she risks not eating enough of her calories from protein.
Same pie. Same label. Different meaning depending who is reading it.
Compare this with an active 53kg teenage girl who needs 2100-2300 calories a day and 50g of protein.
If you don't know your rough numbers, the percentages on packets are just decoration, because they don't adequately accommodate either of these people, they're a general representation.
Let's read some real labels
Worked example 1: choosing a healthier cookie
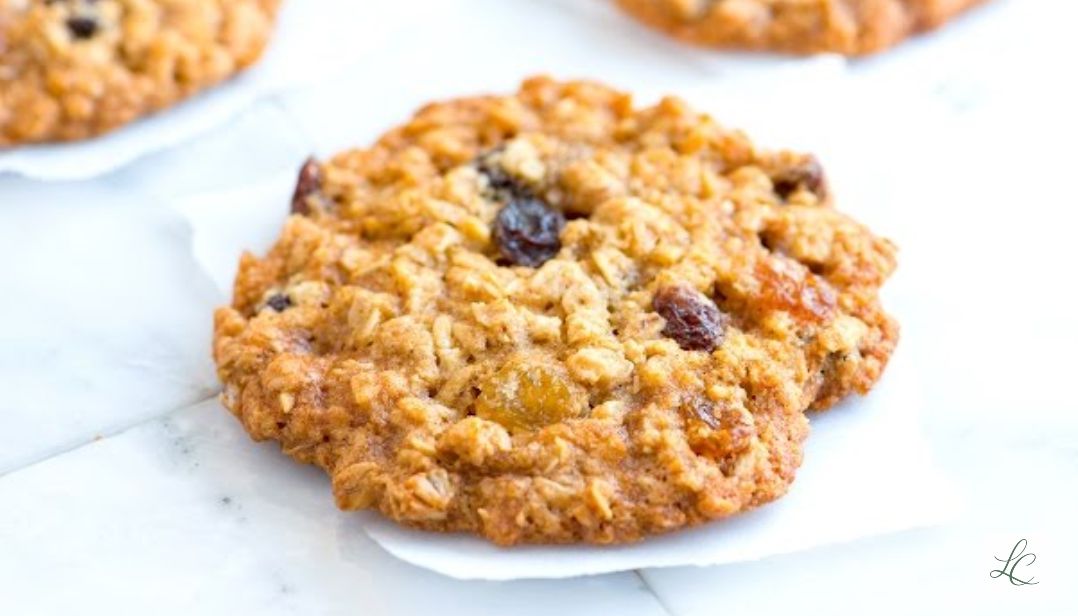
Here are two types of oat biscuits or cookies. Both are sold on their oats.
Cookie A is marketed as a "breakfast biscuit" with "40% less sugar" and "25g whole grain oats" on the front, in a box of four sealed "serve size" packs. Total weight is 160g.
Cookie B is an oatmeal and raisin cookie from a supermarket bakery counter, sold loose in a paper bag, with 5 biscuits and a total weight of 200g.
Both cookies have a 40g serving size. (Cookie A has 4 x 10g cookies in a serve, and Cookie B has 1 x 40g cookie in a serve).
Step 1 — the ingredients.
Cookie A's first ingredient is oats. Working from the "25g oats per 40g serve" on the front, it's about 62% oats.
Cookie B's first three are refined wheat flour, sugar, then oats, and the percentage in brackets says oats (10%), raisins (10%). Sugar sits ahead of both of the things it's named after. Then honey appears further down, and molasses further down again: three sugars on one list. And palm oil appears twice, once inside the margarine and once by itself.
That's the decision made, and we haven't looked at the panel yet. Cookie A is already the healthier choice based on this ingredient list.
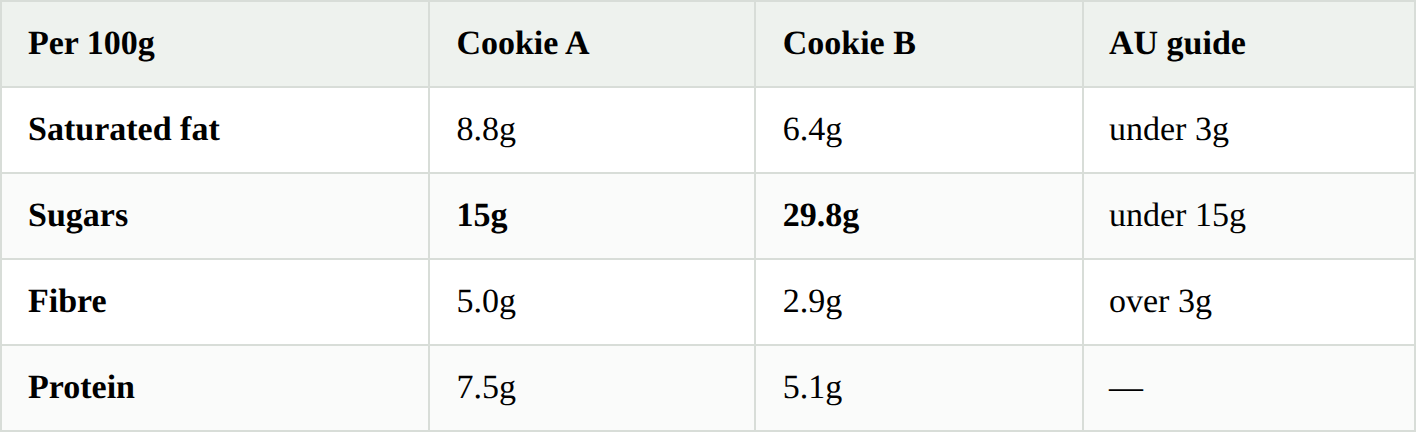
Step 2 — the panel, per 100g (both serves are about 40g, so this is a fair comparison either way):
Step 3 — the verdict, with context.
Neither is a health food. Both are over the saturated fat guide, and both would score red for saturates on the UK system. They're biscuits. That was always going to be true.
But Cookie B has twice the sugar, half the fibre, and less protein. Nearly half of its carbohydrate is sugar, compared to a quarter for Cookie A.
Here's the bit that catches people: both cookies have almost exactly the same total carbohydrate, 60g and 60.9g per 100g. Read only that line and they look identical. The sugar line is what separates them.
The lesson: the "40% less sugar" claim on Cookie A is true. But sugar was never Cookie A's problem, and comparing it to Cookie B gives the claim some weight. But if you look at the saturated fat, and the front of the pack says nothing about that, this is where you realise that the sugar claim is a marketing trick. A claim about one nutrient tells you nothing about the others, and it's often there precisely because it's the only flattering number on the pack. This is not a good breakfast choice. This is a cookie by any other name, not a health food.
And step 4: if you're eating one of these, the sealed four-pack is easier to stop at than an open bag of five. That's not on the label either, but it matters.
The genuinely useful answer: neither cookie is a meal. At 2–3g of protein they're carbohydrate and fat with protein as an incidental. If you want one as an afternoon or evening snack, have it with a source of protein, a spoonful of nut butter, or a handful of nuts, or even with a glass of reduced-fat milk. That takes the snack to 10–15g of protein, slows the sugar down, and makes the portion self-limiting.
Worked example 2: Is a steak and potato pie a viable lunch?
A single-serve pie from the hot counter at work or the tuckshop? Let's run the same four steps.
Step 1 — the ingredients.
First four: wheat flour, beef (18%), water, palm oil. The palm oil sits ahead of the potato, which comes in at 9%.
So a "Steak & Potato" pie is a little over a quarter steak and potato. The rest is largely pastry and the fat that you need to make pastry.
Step 2 — the panel.
The pie weighs 139g, so this is a portion bigger than 100g. That means the per serve numbers are higher than the per 100g ones, this is the trap I warned against in Step 2.
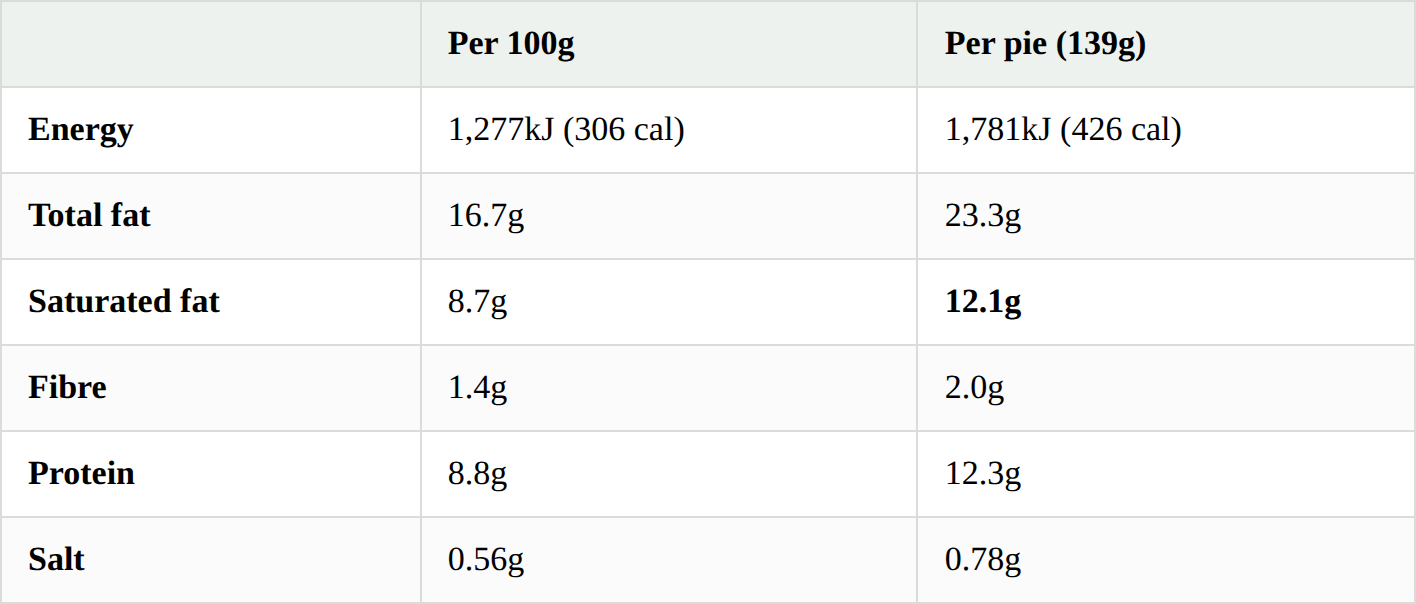
Look at the fat row carefully. 16.7g per 100g is amber on the UK system, under the 17.5g red line. But 23.3g in the portion you're actually eating is over the 21g red threshold for a portion.
Nothing about the food changed. Only which column you read.
Step 3 — the verdict, with context.
The pie is genuinely not bad on everything. Sugar is low. Salt is unremarkable. And at 12.3g, the protein is real — this is proper food, not a biscuit.
Two problems:
- Saturated fat at 12.1g is about 60% of an adult's daily limit, in one item. The saturates-as-a-share-of-fat check explains why: 8.7 divided by 16.7 is 52%, so this is a hard fat, which the ingredients confirm as palm oil.
- Fibre at 2.0g, from a whole meal. You need around 25–30g a day.
And there's a third thing the panel can't show you: there are no vegetables in it at all.
If you eat this pie as one of your meals, you are going to struggle to get your day's protein requirements in and still be under the calorie and saturated fat guidelines for the day, even if you only choose lean protein for the rest of the day.
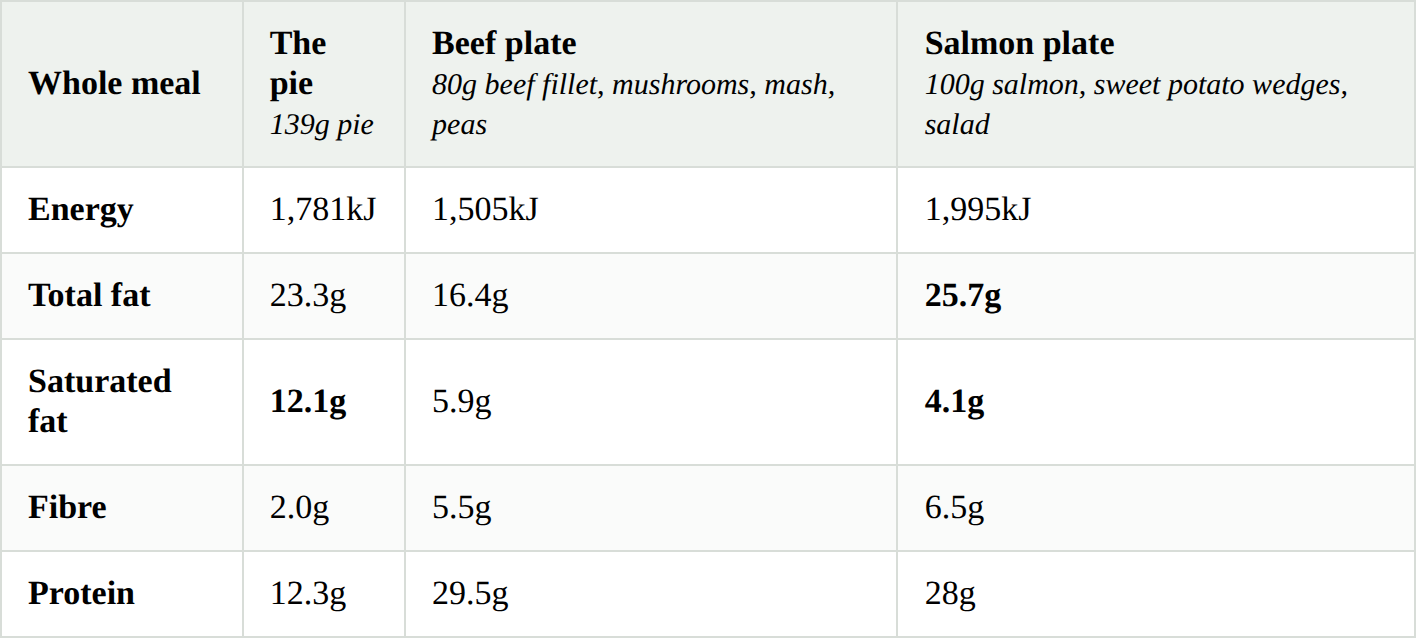
Step 4 — and compare it to lunch you'd make yourself, or an alternative available from a canteen.
Three things jump out, and each one is a lesson.
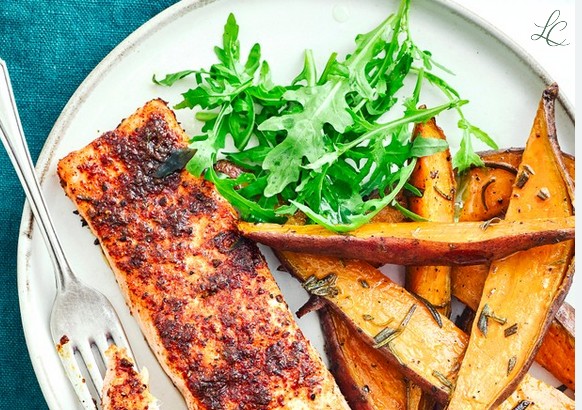
The salmon plate has more total fat than the pie but a third of the saturated fat. 25.7g against 23.3g. On the total fat line alone, the salmon looks worse. But its saturates are 4.1g against the pie's 12.1g, because salmon fat and olive oil are largely unsaturated while pastry fat is not. The same total, an entirely different fat. Plus that salmon carries around 2g of omega-3, nearly a week's worth in one meal, which appears on no label anywhere.
The best meal has the most calories. So be careful of the idea that low calorie is healthier, it's not the whole truth because not all calories are created equal when it comes to nutrition. The salmon plate is the highest-energy option on the table but still comfortably the superior of the three. Energy tells you how concentrated a food is. It doesn't tell you whether it's a good meal.
Both real food plates have more than twice the protein. 28–29g against 12.3g. That's the difference between a meal that keeps you going until dinner and one that doesn't.
So... is the pie a viable lunch?
Occasionally, yes. It's a reasonable convenience food if it does contain real beef. But, every day, no. Not because it's a "bad food", but because for the same energy it does roughly a third of the nutritional work, and it brings no vegetables and almost no fibre. So if you are going to eat pie, eat it with a cup of steamed broccoli, or steamed peas, so that you at least are adding some fibre and key nutrients to the meal. It can't fix the saturated fat, so keep the rest of the day light on fat.
The twenty-second version
- Read the ingredients first. The first three should be recognisable foods. Watch for sugar and fat under several names. If it's a long list with unfamiliar words, put it back.
- Per serve is the amount you eat. Check the serve size is realistic. Per 100g is how you compare.
- Check the numbers, then check the context. Be guided by: saturated fat under 3g/100g, sugars under 15g/100g, fibre over 3g/100g, sodium under 400mg/100g. Then ask what kind of food it is, the serve you are actually eating and what else you're eating today.
- Know roughly what you need to be healthy. The percentages on the pack are for someone else until you do.
- And the shortcut that beats all four: most of the healthiest food in the supermarket doesn't have a label at all. Eat mostly real, whole food.
If you'd like help working out your own energy and protein requirements, or making sense of what you're currently eating, book a consultation.
About Lisa Cutforth
Lisa Cutforth is a degree-qualified clinical nutritionist and integrative health practitioner, combining her qualifications in nutrition, psychology, neuroscience, and genetics to help optimise health, performance, and lifespan.
Read full bio →